


Graph editor
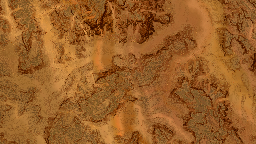
In several panels of NDunes like landmasses, soils and materials, image textures are used. These textures can be modified with the graph editor. It is available through this icon: ![]() .
.
The graph editor at startup
When the graph editor of a texture is opened for the first time it looks like this:
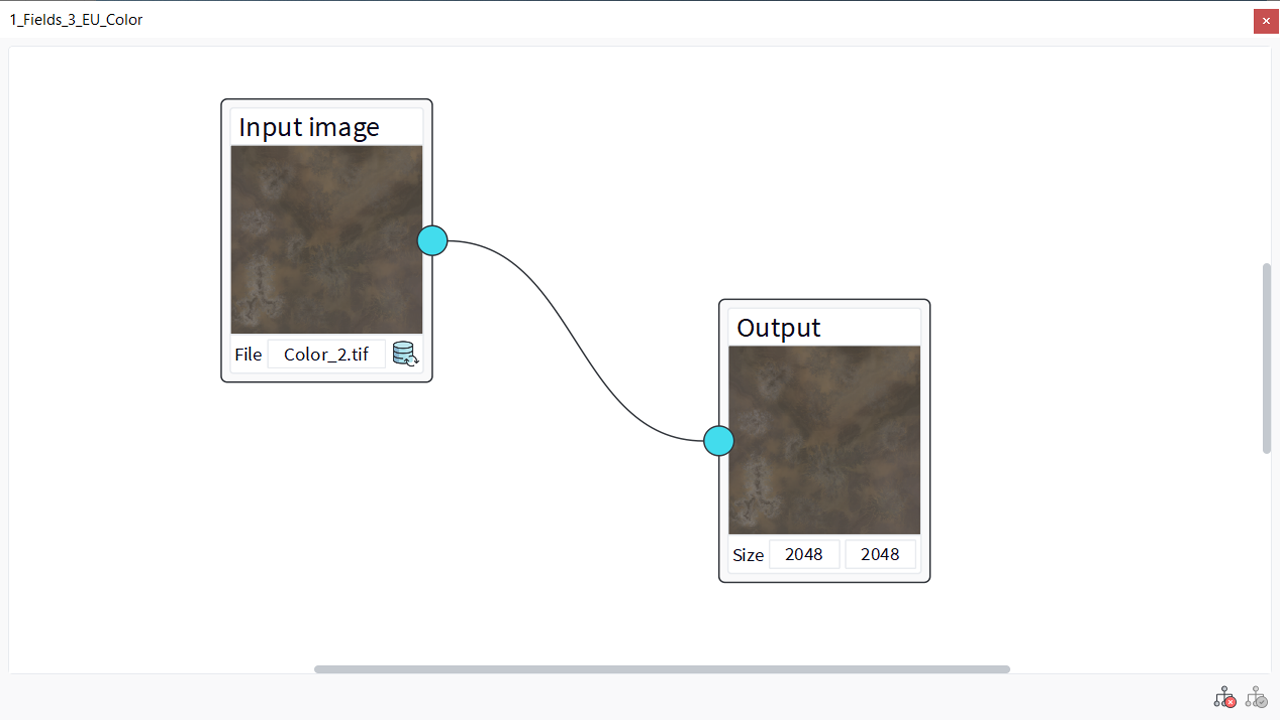
The graph editor panel at startup
We can see an input node and an output node. The input node loads the image on disk. The output node finalizes the image after all the modifications. For now, there isn't any node between the input and the output, so no modification: the exit equals the enter.
The output node allows to set the final image size in pixels.
Note:
The whole graph works with 4 channels (RGBA) of floating values. The output node clamps its input between 0 and 1, so it is very possible for the nodes to work outside of the [0,1] interval. According to the desired texture, the graph may output 8, 16 or 32 bits per channel.
Adding nodes to the graph
Several transformation nodes can be added via a contextual menu appearing on right click of the mouse. Nodes can be operators like add and mix or filters like a gaussian filter. A full list of all the nodes is available here: List of graph nodes.
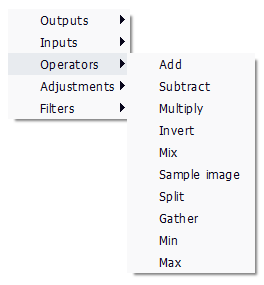
Contextual menu to create new nodes
A node can be removed from the graph by selecting it with a click of the mouse and pressing the Del button of the keyboard.
Each node have inputs and outputs represented by the blue circles on its left and right sides. A node can have several inputs and outputs according to its purpose. The nodes are connected to each others by these circles. To create a connection, simply drag the output (right) shape of a node and drop it on the input shape (left) of another node. The result of the operation is visible in the node preview image.
A connection between two nodes can be removed by selecting it with a click of the mouse and pressing the Del button of the keyboard.
Nodes can also have parameters. They are visible and can be modified in the lower part of the node itself. These parameters can be colors, values, etc.
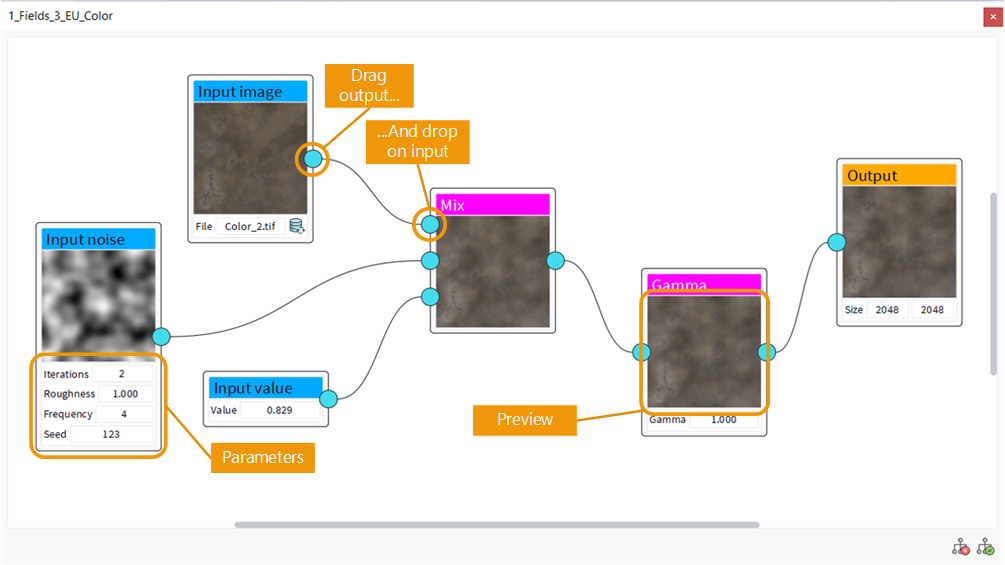
The graph editor panel
Applying the graph editor to the image
At the bottom of the editor panel, we can see two red and green buttons:
- The first one resets the graph. It deletes all the intermediate transformation nodes and links keeping only the input and output nodes.
- The second button allows to apply the graph and generate the final texture in NDunes.
Note:
Make sure to apply the graph with the Apply button before closing it otherwise the modifications will not be effective. In this case, the texture icon will show a warning: ![]() .
.
Changing the color of the node title
The color of the node title can be changed by double click. This feature is provided solely for organizational purposes. It can help the user to manage its groups of nodes and colors.
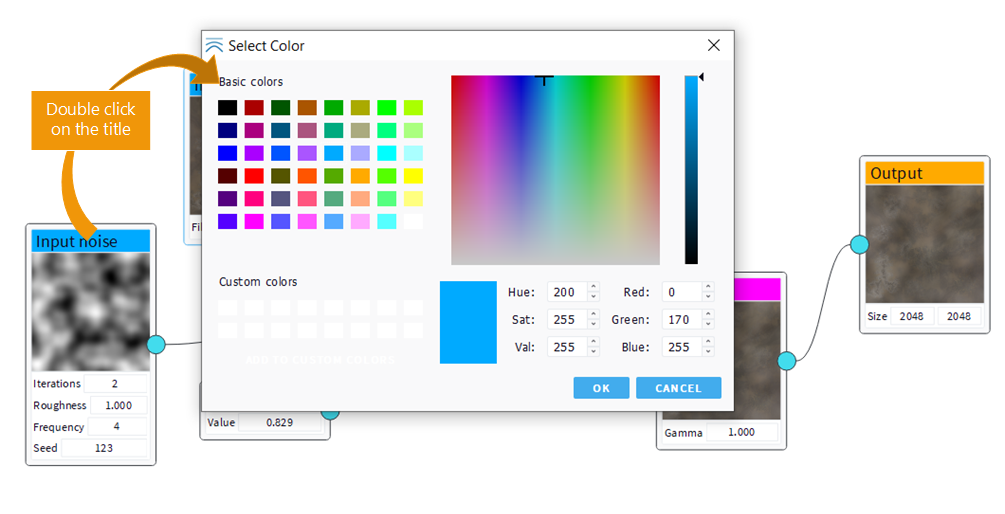
Double click on the title to change its color
List of graph nodes |
