

Performances
The performance panel shows some NDunes statistics and can be used to track performance bottlenecks in a rendering. Informations reported there may be quite technical, so feel free to ignore them.
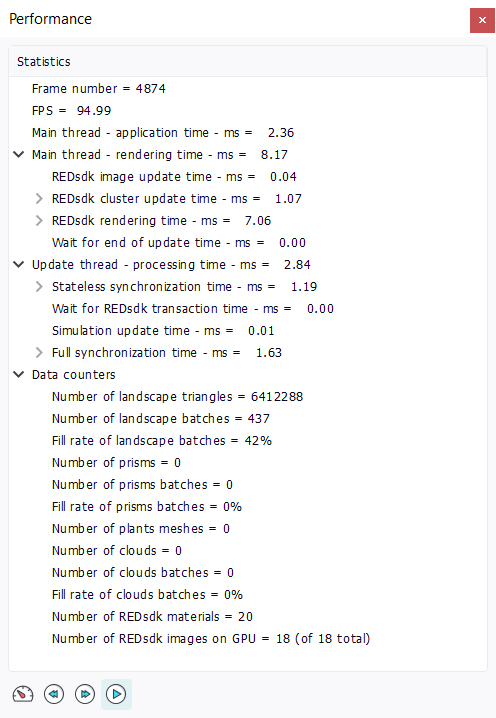
We'll find different sections reporting informations on the current workload of NDunes:
- FPS: A FPS counter. This one is redundant with the FPS displayed by the Information bar, but is provided there for convenience.
- Main thread timings: These timings are related to tasks performed by the main thread of the application. The main thread handles the application event loop and the rendering. Details of the rendering sequence will give informations on the different rendering passes involved in the rendering of a frame.
- Update thread timings: The update threads collects all auxiliary threads calculations and updates the world displayed by NDunes. We'll find other timers here.
- Data counters: Here we find numbers of entities displayed by NDunes. The number of triangles composing the landscape, the number of plants prisms being displayed as well as the number of clouds. Some details on their batching architecture are provided too.
Turning on performance measurements
By pressing the left icon of the toolbar at the bottom of the panel (the speed needle), performances measurements will be turned on. This will slow down the rendering by 30-50% as detailed timers will be enabled for all detailed steps of the rendering. Once enabled, unfolding measurement counters will help understanding bottlenecks in the display. Don't forget to disable these timers once done, or you'll remain slow!
By pressing the rewind button, NDunes will stop displaying the current frame and display timers that were recorded for the previous frame. The last 600 frames can be rolled back using the rewind button to isolate performance peaks and bottlenecks. By pressing the play button back, the current frame will be displayed again. So using these buttons can be handy to move backward and forward in the performance history of NDunes.
Note that displaying the performance panel has an influence on the performance measurement itself due to the time needed to update the UI for it. This adds to the performance interference caused by the activation of timers. That's also why percentages are displayed with each value to get an idea of their importance on the total time.
 Tonemapping Tonemapping | Settings |
